
Custom SaaS Development
Sales Reports for WooCommerce
Store analytics a shop owner will actually read
- Industry
- E-commerce software
- Location
- Built in Pittsburgh
Who they are
Sales Reports is a WooCommerce plugin we designed and built. It installs into any WooCommerce store and adds the sales reporting the platform does not give a small shop owner out of the box.
What they needed
WooCommerce stores generate plenty of data and show very little of it in a form a busy owner can use. The questions are always the same and always awkward to answer: what actually sold this month, is that better or worse than last month, which products carry the store, and where in the country are the orders going.
Getting those answers usually meant exporting orders and building a spreadsheet, which is exactly the kind of job that quietly never gets done.
What we built
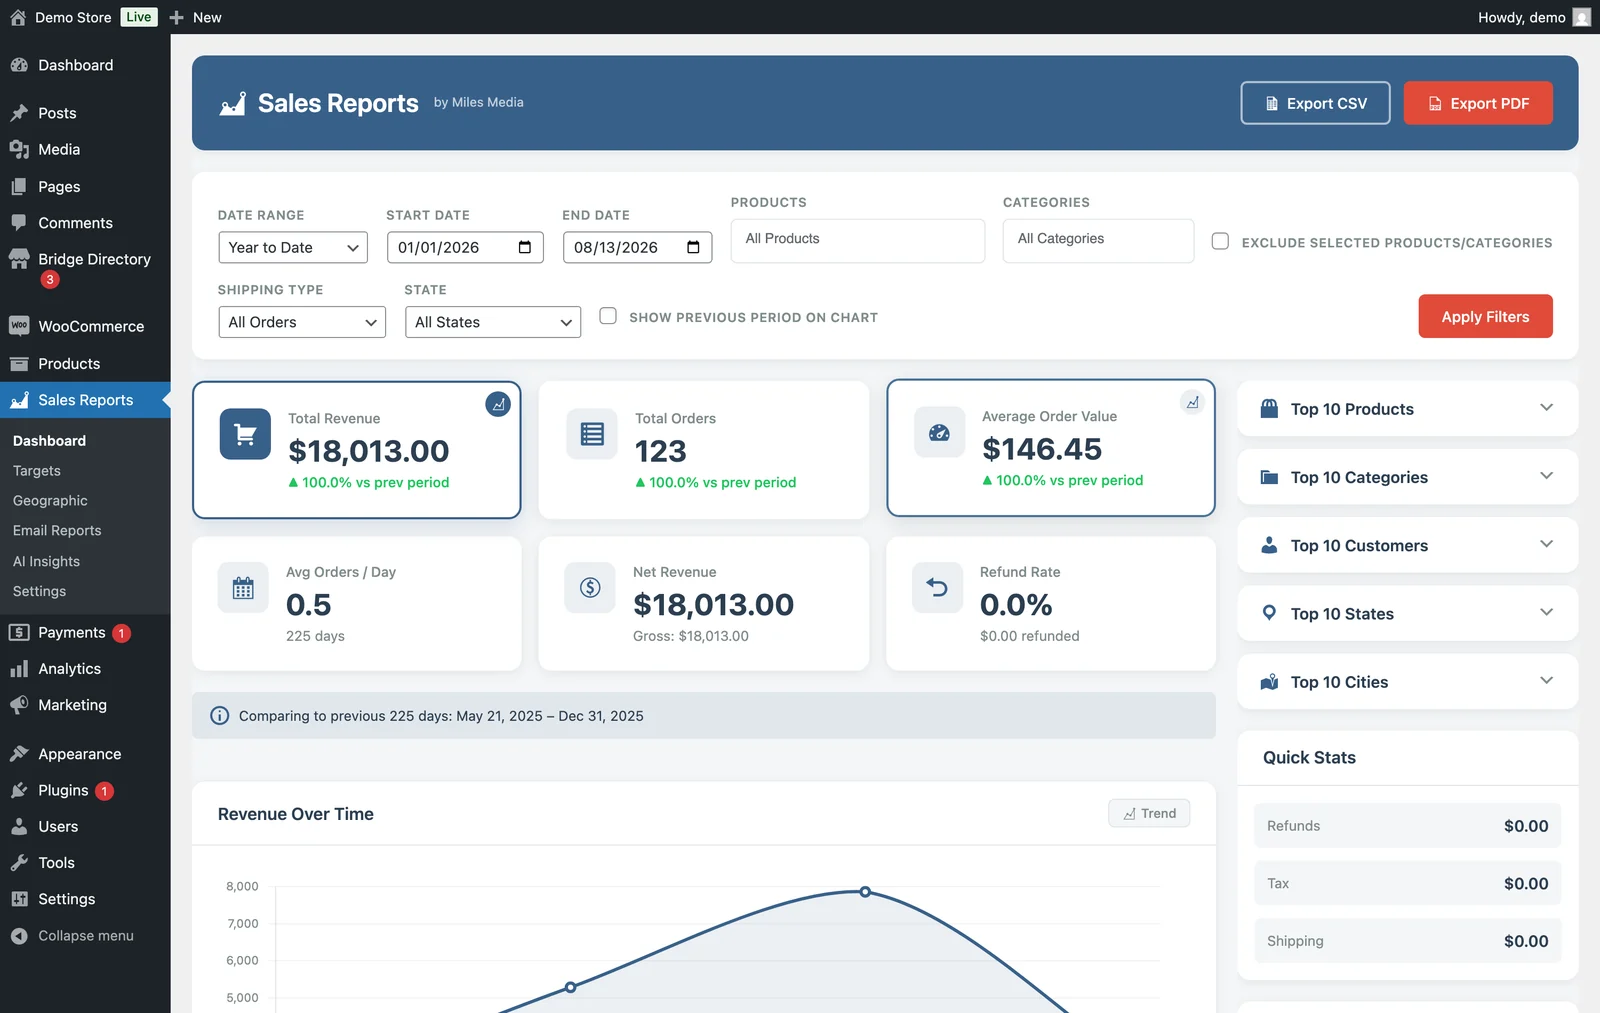
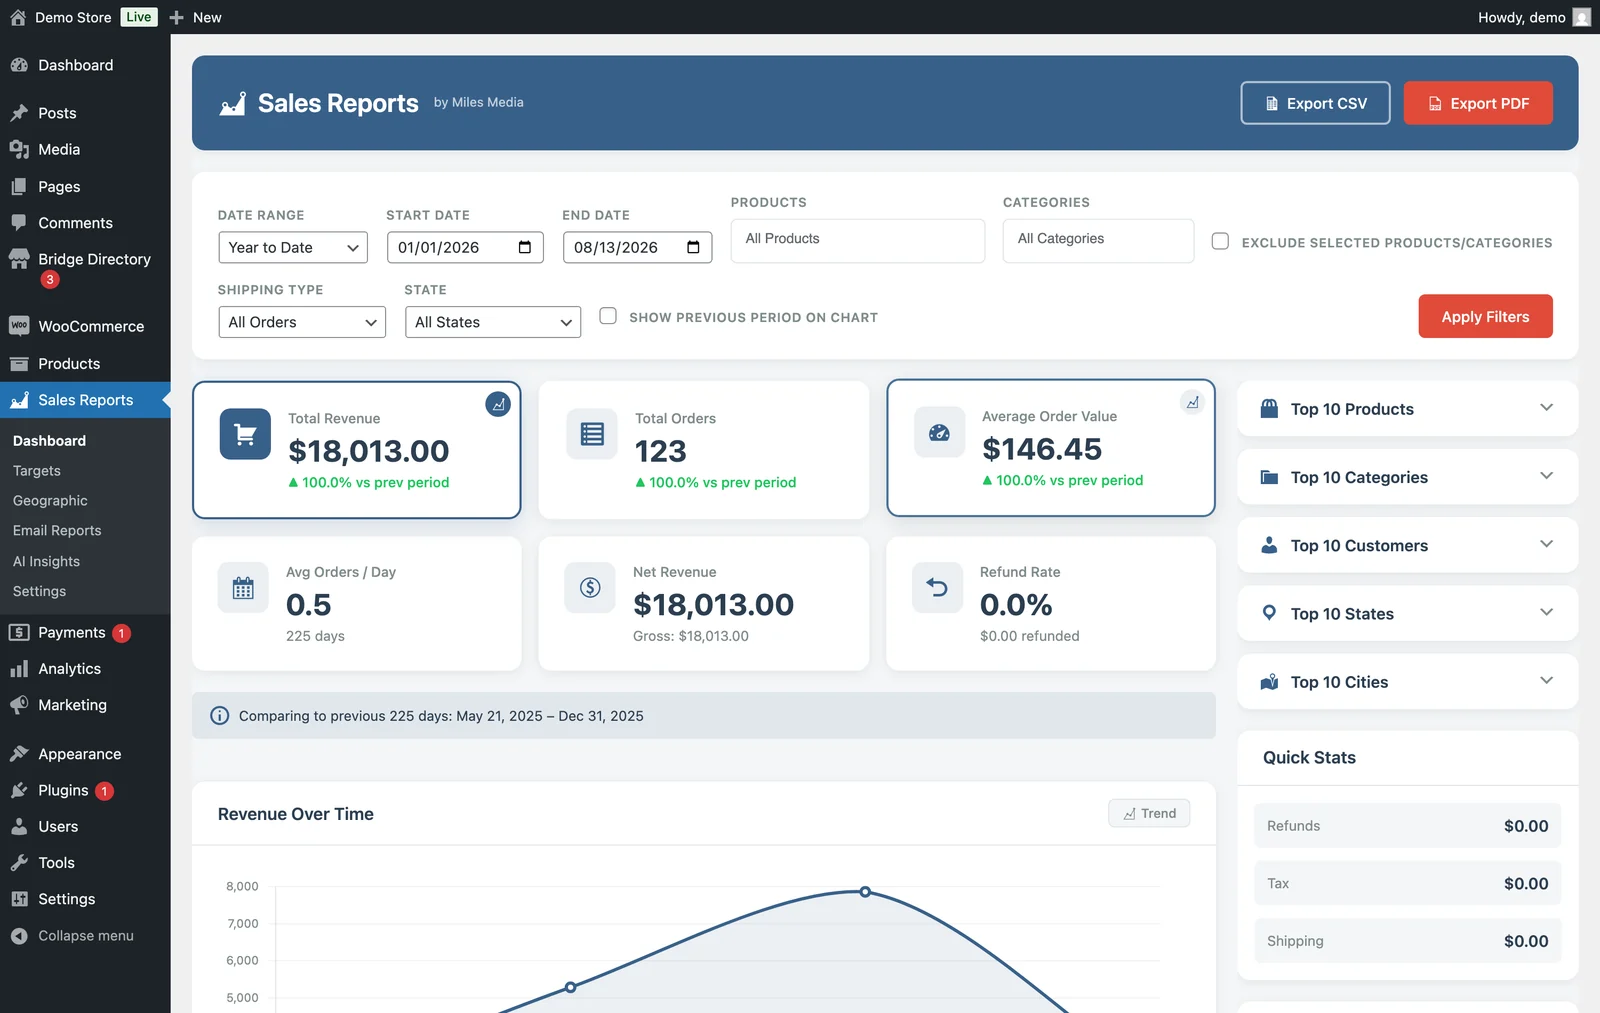
The plugin adds a dashboard inside WordPress that answers those questions on the screen. Revenue, order count and average order value across whatever date range you pick, each compared against the previous period of the same length, so the number always arrives with context rather than on its own.
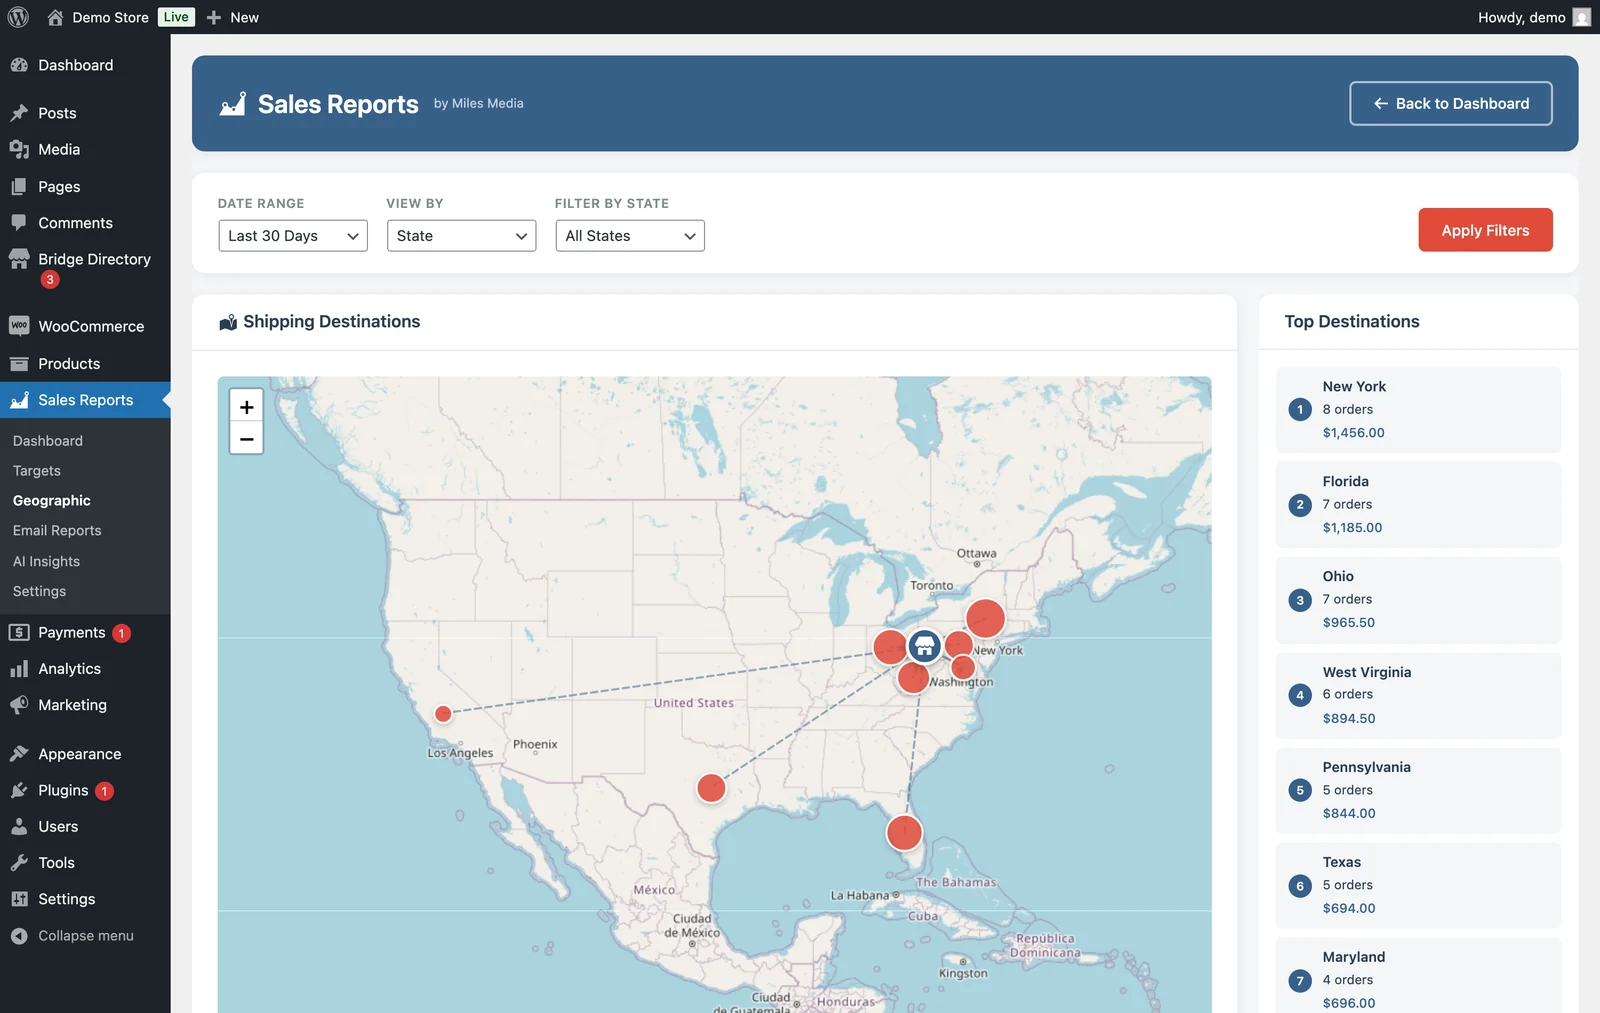
Filters run across products, categories, shipping type and customer state, so an owner can ask a narrower question without exporting anything. There is a geographic view that maps where orders ship and ranks the top destinations, which tends to be the report that changes someone's advertising plan.
Anything on screen exports to CSV for a spreadsheet or to a formatted PDF for sharing. Results are cached so the dashboard stays quick on a store with real order history behind it.
What made the difference
Every number comes with a comparison
Each headline figure is shown against the previous period of the same length, because revenue on its own does not tell an owner anything.
Answers without a spreadsheet
Filter by product, category, shipping type or state right on the dashboard, rather than exporting orders and building a pivot table.
Where the orders actually go
A shipping map and a ranked list of destinations, which is usually the report that changes where somebody spends their ad budget.
A look inside
Screens from the software itself, running with sample data.
The dashboard
Revenue, orders and average order value for the chosen range, each against the previous period, with filters above and top products, categories, customers and states down the side.
Where orders ship
Orders plotted by destination with the top states ranked by revenue, so an owner can see which markets are worth spending on.
Need something built?
Every project here started with a conversation about what the business actually needed. Yours can start the same way.
Get a Free Consultation